How to Measure Your Marketplace Success: the Key eCommerce Marketplace Metrics
When the Amazon founder, Jeff Bezos, was offered to sell advertising on the ecommerce marketplace store homepage, he answered that “It is one of the stupidest ideas I’ve ever heard.”
Nevertheless, he approved the idea, and currently, Amazon Advertising is worth almost $2.2 billion and is one of the virtual marketplace most-profitable services.
It demonstrates the Amazon Culture of Metrics in action: Bezos approved this idea solely because it was proved by data.
Metrics or key performance indicators, help you to measure the success of an ecommerce business in achieving its goals.
There are multitudes of KPIs in e-commerce. To measure your ecommerce multi seller marketplace platform success accurately, it’s best to form the set of metrics on the basis of your goals.
1. Business growth and profitability
There are many KPIs to evaluate business development in e-commerce, and the following are fundamental for online shopping marketplaces.
1.1 Gross merchandise volume (GMV)
It’s an equivalent of the total order value, and is measuring the dollar value of items sold in an Internet marketplace mall over a given period of time.
It is a fundamental KPI for ecommerce multi seller marketplaces: it helps to measure business growth, and the usage of a virtual shopping mall website by sellers.
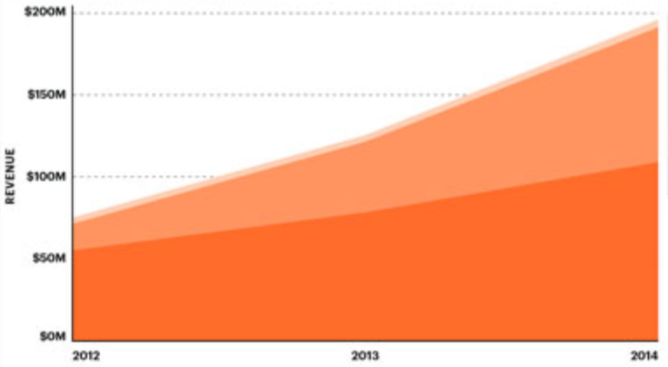
Etsy GMS, the online marketplace equivalent of GMV (the domestic GMS is marked with orange, the international GMS is marked with pink):
The indicator is showing the ecommerce marketplace store growth, which is up to 14.5% in 2017 compared to 2016.
It is calculated prior to the deduction of any expenses, although shipping fees, net of refunds and returns should be excluded.
It is most useful as a comparative measure over time and is tracked on a monthly and yearly basis.
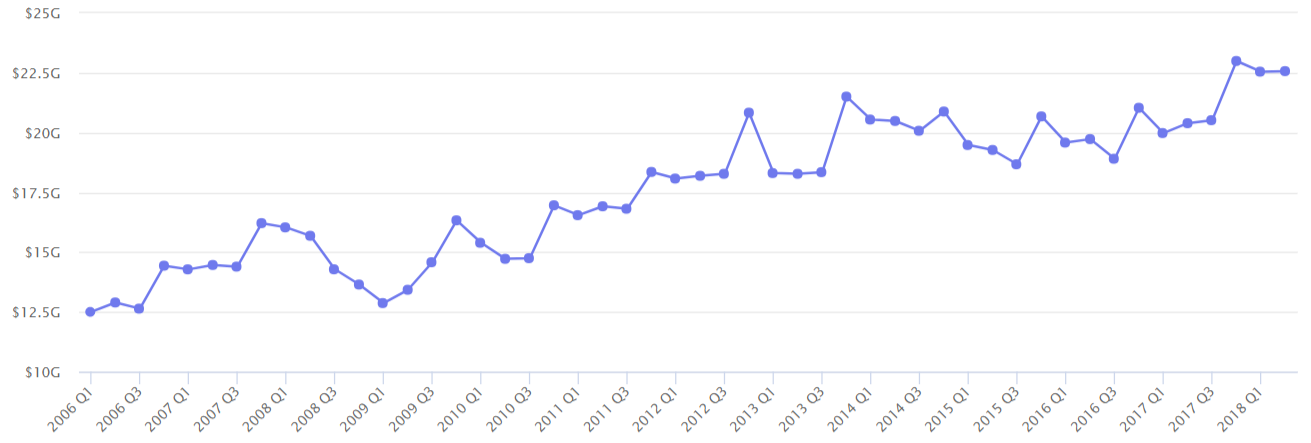
eBay Gross Merchandise Volume growth year over year:
For service online shopping marketplaces, it’s important to take into account the difference between “contracted” and “delivered” GMV figures. In some service Internet shopping mall concepts, such as house selling platform like Opendoor, there can be a delay between the two, which can cause incorrect GMV, if “contracted” figures are computed.
Average Order Value (AOV)
It reflects how much customers spend for every order they make, sales per each order, not per customer.
This metric helps to see your virtual marketplace store growth by reflecting the average transaction value, and profit increase.
Additionally, it gives insights about customers’ behavior:
- whether or not clients are buying multiple items;
- the items of what cost are the most popular on an ecommerce multi seller marketplace platform;
- the volume and frequency at which buyers are willing to spend.
It’s calculated monthly, weekly or daily, by dividing the total revenue by the number of transactions.
AOV = total revenue / number of transactions
By increasing AOV, you automatically increase Return on Marketing Investment (ROMI).
Revenue
It measures the income that the eCommerce multi seller marketplace receives, in form of transaction fees, listing fees, and seller services.
It helps to track the efficiency of the virtual shopping mall website concept, and to break down the revenue flow to analyze its components.
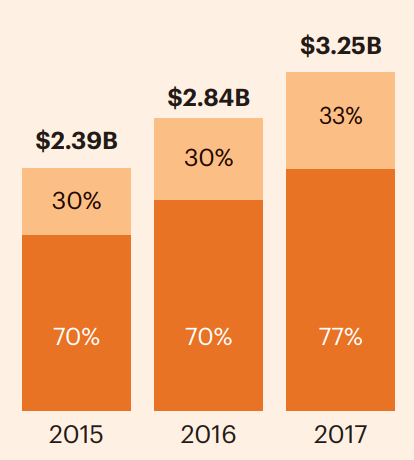
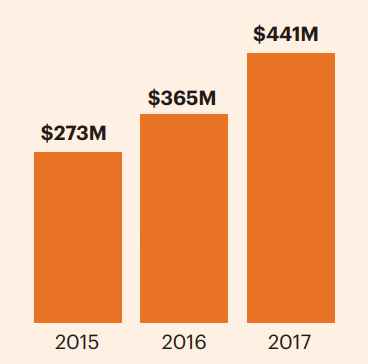
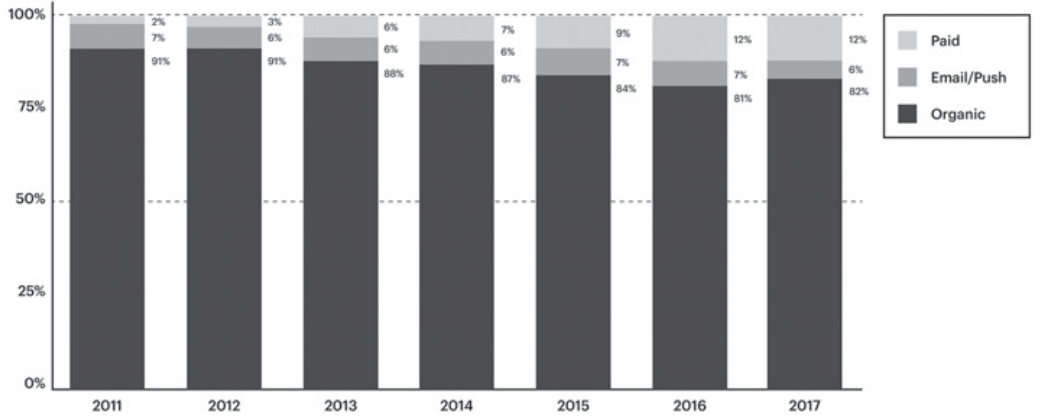
Etsy’s annual revenue:
The online shopping marketplace revenue comprises two parts:
- an ecommerce marketplace store transaction fee and listing fee (marked with orange color);
- seller services: direct checkout, promoted listings, shipping labels (marked with pink color).
The metric helps the ecommerce multi seller marketplace platform to track the efficiency of both parts of the revenue.
For the second part of the revenue—seller services, the virtual marketplace store has detailed metrics as well:
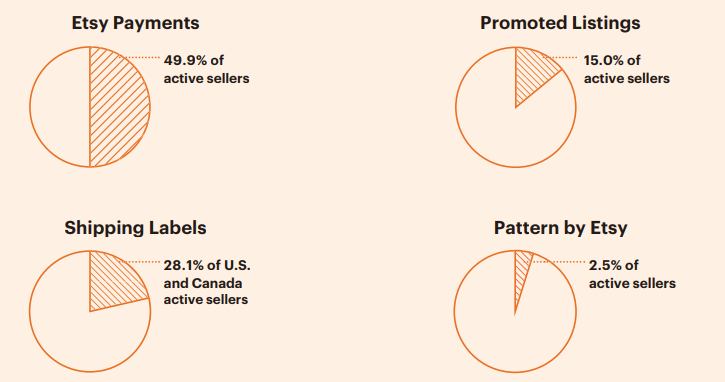
It helps to track and increase the efficiency of the Internet marketplace monetization model concept.
To gain a more granular view of seller services (value-added services), use an Average revenue per user metric.
Revenue also helps you to track the overall ecommerce multi seller marketplace growth year over year.
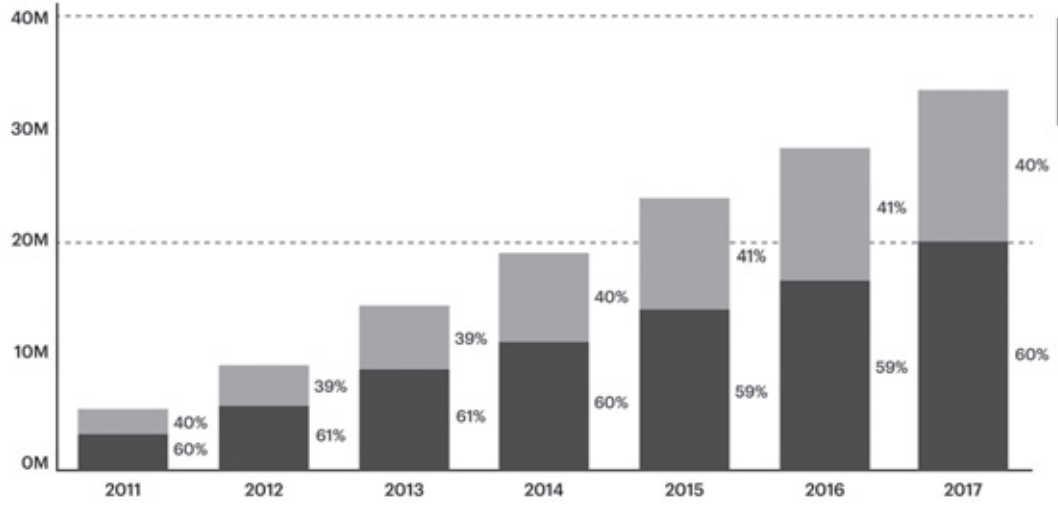
Etsy’s year-over-year revenue growth:
Revenue is calculated differently for various ecommerce marketplace stores, here is a guide on how to count it correctly.
Fulfillment rates
It reflects the percentage of the times when your online shopping marketplace delivers goods or services as promised.
It’s calculated through the following formula:
Fulfillment rate = The number of fulfilled orders / Total number of orders (including rejected, but excluding canceled orders)
If fulfillment rates are getting negative, it’s necessary to use more narrow metrics to identify the reasons: if there are concrete items, services or suppliers with the most frequent fulfillment failures.
1.2 Supply side development
Quantitative growth
These metrics do not reflect the performance that is directly connected with the eCommerce marketplace store’s main goals, like conversion and purchasing, and are useful when you are actively embracing the new market category, or scaling your virtual shopping mall website concept.
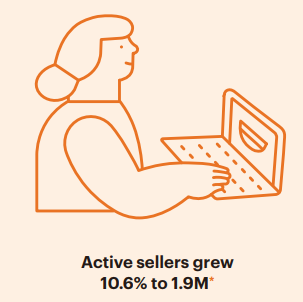
- number of suppliers (it’s best to measure active sellers’ growth, with the monthly active users‘ metric), like Etsy:
- suppliers’ growth rate;
- number of listings, and for a services web marketplace, count the number of active suppliers at a specific time instead;
- listings growth rate;
- users’ churn.
Qualitative growth
These KPIs help to see not only your Internet marketplace mall performance growth but give insights on what is influencing that growth. They are also applicable for the demand side.
- users concentration: number of sellers vs. the percentage of business they generate over a period of time; it is measured with whale curves metric.
It helps to track the most successful seller’s percentage and to define which seller types, goods or services are your virtual marketplace store growth drivers.
- cohort analysis: showcase the continued activity of a group of users acquired during a specific period of time, a week, month or a year ago.
Without metrics that are based on cohorts, you can only track which channel is driving the most traffic.
Etsy visits by channel:
With such metrics, by analyzing the behavior of cohorts —user groups who came through those channels a month or a year ago, you can also tell which channels are driving the most conversions.
1.3 Demand-side development
Quantitative growth
- overall number of customers, and active buyers amount;
- buyer growth rate;
- churn rate.
Qualitative growth
- average dollar amount purchased per buyer;
- average number of orders per buyer;
- average order growth per buyer;
- customers’ satisfaction, measured regularly through the NPS (Net Promoter Score) metric and customer feedback;
- customer conversion percentage;
- repeat purchases.
Etsy’s repeat purchases metrics (the one-time purchases are matched with the dark color, the multiple purchases are matched with the light color):
1.4 Liquidity
Liquidity indicates how successful the ecommerce multi seller marketplace platform is for sellers and buyers, and shows a marketplace ability to scale.
It’s calculated through the following formula:
Customer liquidity = visits on a given time period / transaction number
However, it may be counted differently depending on an ecommerce marketplace store type.
On Etsy, it is the proportion of total stock which is sold monthly. On Airbnb, it is the proportion of rooms which are booked each night. On Uber, it’s the percentage of drivers that are driving customers at any given hour.
Thus, there are basic metrics that help to track liquidity on any online shopping marketplace:
- how long it takes to make a transaction;
- the percentage of goods or services that are purchased hourly, daily, monthly;
- the percentage of listings that lead to transactions within a certain time period.
1.5 Client’s acquisition and retention
There is a multitude of metrics aimed to measure communication with clients. While some of them are soft KPIs that help you to track intermediate results like cost per click, the following are fundamental metrics, which show if you get a real value, purchases, and repeat buyers, in return for your investments.
Return on Investment (ROI)
The metric shows what you gain out of your marketing investment—whether it’s profitable or not.
It’s calculated through the following formula:
ROI = (Profit – Investment) / Investment x 100
When using the metric, it’s necessary to take into account not only the instant profit but long-term benefits as well:
Your investments are: $5000 in organic traffic, and $500 in a paid ad.
Number of clients acquired: 30 through organic traffic and 10 through a paid ad.
Average checkout amount for both: $150
Therefore, ROI out of organic traffic:
(30 Х 150) — 5000) / 5000 Х 100 = — 10%
ROI out of a paid ad:
(10 Х 150) — 500) / 500 Х 100 = 200%
The metric shows that a paid ad result in a better profit.
However, ROI should always be calculated considering another metric—Customer Lifetime Value.
Customer Lifetime Value—total amount of sales that a client has generated over time.
The way Customer Lifetime Value is affecting ROI results is the difference in the quality of traffic that organic traffic and a paid ad brings.
Online customers that came through organic traffic are of much better quality and are more loyal, therefore, the probability is high in such a way that they are the ones who make repeat purchases.
Thus, Customer Lifetime Value metric can bring the following data to the equation:
Average Customer Lifetime Value for clients from organic traffic: $10,000.Average Customer Lifetime Value for clients from paid ads: $600.
In this case, you take into account the long-term profit as well, and ROI is the following:
ROI out of organic traffic:
(10.000 — 5000) / 5000 Х 100 = 100%
ROI out of a paid ad:
(1500 — 500) / 500 Х 100 = 200%
Calculating ROI in this way will lead to a clearer picture in terms of the long-term profit that you get.
1.6 Customer Acquisition Cost (CAC)
This metrics show how much you need to spend to get a paying customer.
It reflects not only soft results such as clicks or page views, but your revenue, since it measures your performance in making somebody a customer.
You may invest marketing budgets to get good pageview results but will gain one sale out of those results. It means, your cost per acquisition is the entire budget spent to date.
That’s why it’s necessary to use CAC metric when measuring your marketing efforts.
It’s calculated by the following formula:
Cost Per Acquisition = Total costs associated with acquisition / Total new customers over the measured time period
Those are fundamental metrics that help in measuring the main points of your Internet marketplace mall performance accurately.
However, many ecommerce multi seller marketplaces have different sets of KPIs. They were formed on the basis of online mall goals or concepts.
Etsy set of KPIs:
- Gross Merchandise Value (GMV);
- percent mobile Gross Merchandise Value;
- active sellers / active buyers;
- percent mobile visits;
- percent international GMV;
- the top retail categories.
The virtual shopping mall website is measuring the percentage of Gross Merchandise Value gained through mobile, since its intended audience is actively purchasing through mobile devices. Approximately, 51% of the virtual marketplace store GMV came from mobile purchases.
True experience #1

Natasha Birch, Digital Marketing Consultant
Natasha has over 10 years of experience working in digital marketing and with integrated marketing campaigns and currently works for Living Online a full-service digital marketing and growth creation agency in Perth, Western Australia.

Metrics are important for all businesses, but are even more important when it comes to marketplaces, which are essentially the digital versions of the traditional retail environment. Without metrics, how do you know how you are performing, set and measure KPIs and most importantly, run a viable business?
The key marketplace metrics I focus on are:
- Growth – The number of sellers and buyers using the marketplace
- Liquidity & AOV– The transactions taking place between the sellers and buyers and the average order value
- Retention & LTV – The number of repeat purchases and users and their life-time value
- Margin – How much is the marketplace actually making when all costs are taken into account
Google Analytics has a wealth of data available if you know how to correctly configure and collect the information, by setting up events and conversion tracking and custom reports to provide quick insights into the data required for measuring each of the marketplace metrics.
True experience #2

Nate Masterson, the Marketing Manager for Maple HolisticsMaple Holistics, a company dedicated to all-natural and cruelty-free personal care. Backed by education in finance and communication, Nate has been able to pursue both his professional and leisurely passions by working with Maple Holistics on becoming a leader in e-commerce. Originally from Riverdale, New York, Nate now works for Maple Holistics at their headquarters located in Farmingdale, New Jersey.

In today’s world of analytics, artificial intelligence and inter-connectivity, companies can’t afford to ignore the metrics at their disposal. The key to running a successful business in today’s day and age relies on close attention to the data and metrics you collect.
SEO is the biggest, most important metric to follow. Where your website sits on the google search list, and how it ranks are integral to getting clicks, site visitation and ultimately generating revenue. If you take growing your business seriously you should take SEO seriously.
For digital marketers, Ahrefs makes it easy to assess if your content marketing efforts are effective. It provides comprehensive breakdowns of links to your website, mentions of your business, as well as keywords that your content may rank for, Ahrefs is a necessity for any company looking to get into content marketing. With all the tools at your disposal in Ahrefs, you can prioritize correctly in order to get the digital reach you need.
Google analyticsallows you to see such metrics as click-through rates, how average page engagement, and all kinds of metrics that will make you fast better and stronger as a company.
SEMRushhelps you track your keywords in order to rank high on search engines with the content that your company’s posting. Knowing what keywords are used to rank on search engines like Google, and will help you make your content relevant to your target audience.
True experience #3

Onyx Adegbola, Founder & CEO of Casa de Sante. Casa de Sante makes it easier to live with IBS with a wide variety of low FODMAP food list & low FODMAP Snacks.
We’ve tracked our marketplace metrics very carefully to grow our ecommerce healthy foods business from a one-person startup to a fully staffed business with growing revenue.
We track the number of monthly active users we receive along with bounce rate and the average time that users spend on our site. These metrics give us an idea of how many new visitors we’re gaining each month and whether they’re navigating through the site to make purchases.
True experience #4

Steve Page, VP of Digital Strategy. With more than 4000 satisfied customers, Giant Partners provides comprehensive digital marketing services including search optimization, content creation, lists, email, social outreach, messenger, PPC management, display advertising, lead nurturing, and more. Learn how we can help you accelerate sales at giantpartners.com

It’s important to use marketplace metrics, especially at the beginning to see where you compare to similar products in your industry. For example,Conversion rateis a big metric Shopify even alerts you if you are above or below other stores in the same category. However every product can have a unique price point or feature that has an effect.
– Conversion rate: Tells you how many people finish go from start to finish. Adjustments to improve this are never-ending.
–Bounce Rate: Tells you how many people go to your page and leave immediately. If this is high you have big problems.
– Cart Abandon Rate: Tells you who is leaving when they are buying what product. There are many in cart things you can do to improve this like timers, one-time offers, recovery emails and messages to help with this.
We use :
– Google Analytics: Gives you so much data for your entire buying process as well as website data
– Hotjar: Allows you to see what’s the most effective parts of your website and what people are skipping over.
Besides, the key to effective metrics is having as few as possible.
You put all efforts in increasing only meaningful performance that brings real value: purchases or repeat clients.
Back then, the Airbnb eCommerce multi seller marketplace platform concentrated on just one metric which was the most important to them at that time: nights booked.
It helped to set priorities: acquire the clients who book more nights, or listings that collect more bookings, or are booked for a longer term.
Another important point—use theactionable metrics, not thevanity metrics,like pageview results.
Actionable metrics measure the real value and help to make decisions, while vanity metrics may look good on paper, but doesn’t offer clear guidance for what to do.

Yan Anderson is the Head of Content Marketing at CS-Cart with over 10 years of experience in the eCommerce industry. He's passionate about explaining complicated things in simple terms. Yan has expertise in building, running and growing eCommerce marketplaces. He loves to educate people about best practices, new technologies, and trends in the global eCommerce industry.