
6 E-commerce Marketing Stats Every Business Owner Should Care About
E-commerce marketing isn’t what it used to be. Simply putting together a store, adding a payment method, and sharing a few links on social media isn’t enough to win customers anymore.
Nothing captures this change better than hard data. From personalization to traffic sources, I’ll look at some essential stats every e-commerce business owner should know to thrive in 2020 and beyond.
1. 80% of Customers Are More Likely to Buy With Personalization
Personalization has been a buzzword in e-commerce marketing for over a decade. Seriously, just consider the Google Trends data for “personalization”:
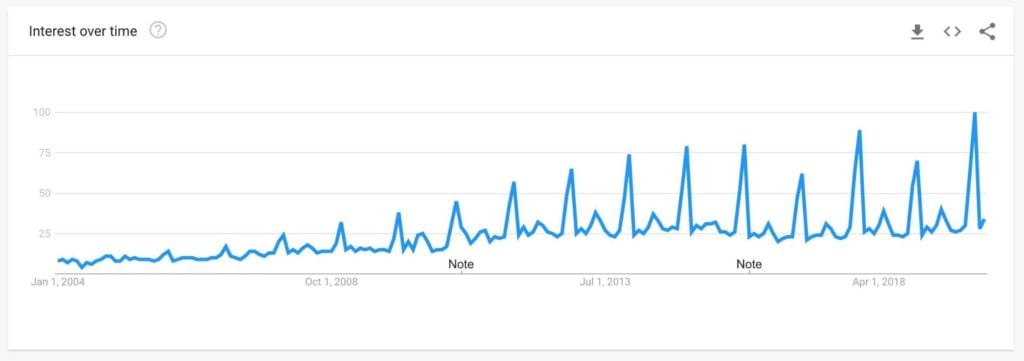
This interest isn’t unfounded; as a late 2017 study by Epilson concluded, 80% of customers are more likely to buy if they’re offered personalized experiences. An additional 10% (90%) customers also said that they find personalization “appealing”.
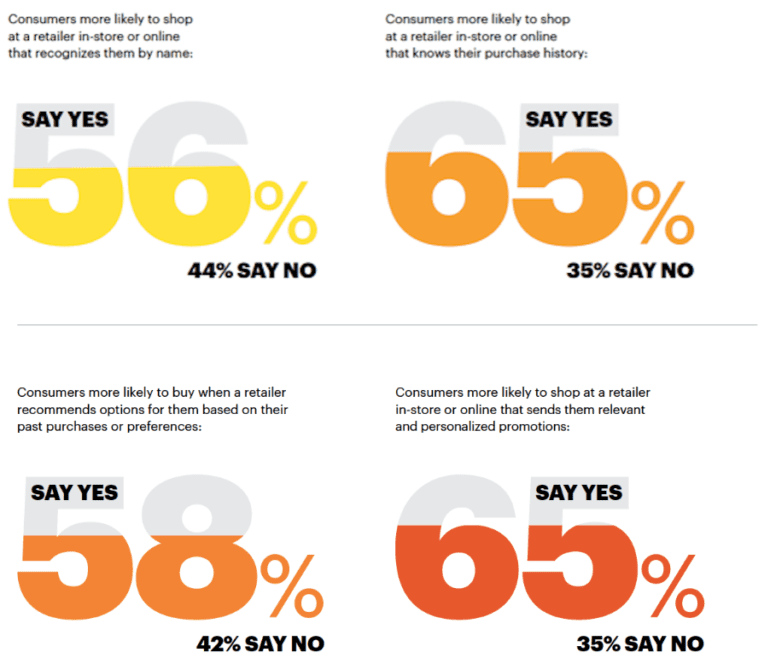
The numbers from this study are corroborated by others as well. Accenture, for instance, found that customers are happier and buy more when their shopping experience is personalized.
Personalization is the internet equivalent of the cashier remembering your name at your local grocery store. It might not make or break that particular purchase, but it trains your preferences.
In a hyper-competitive e-commerce landscape, the retailer that knows you and your likes/dislikes more is most likely to earn the transaction.
The best argument in favor of personalization is none other than Amazon. Just pop into your Amazon account right now. You’ll likely see Amazon greeting you by name. And you’ll see personalized recommendations based on your past purchases.
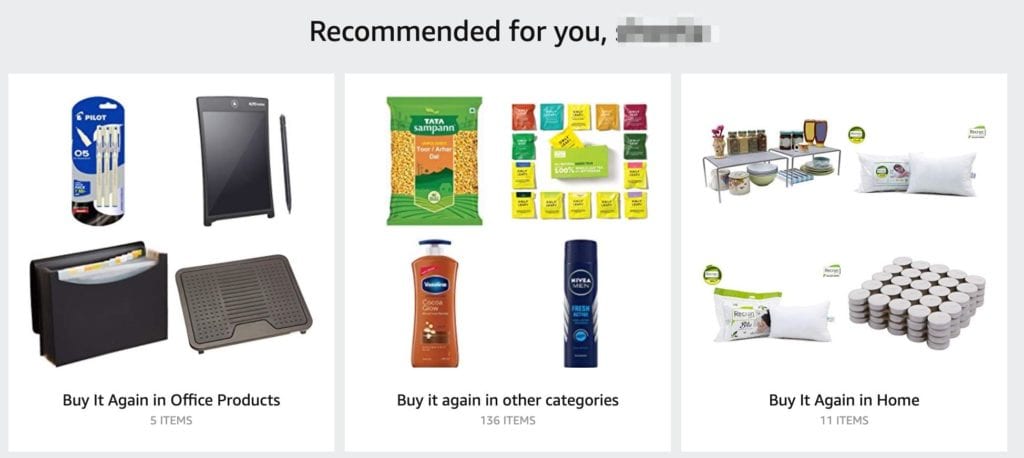
If the world’s biggest e-commerce company is doing it, it’s a good idea to follow along. Make personalization a core part of your marketing project plan and you’ll reap rich dividends in conversions and higher CLTV.
2. Mobile Accounted for 67% of All E-Commerce Sales
Mobile commerce is eating e-commerce.
If the legions of people glued to their screens everywhere weren’t proof enough, this graph from Statista should help:

The trend is particularly strong in emerging markets, especially China and India. While mobile commerce is less than 50% of all e-commerce sales in the USA, it is nearly 75% in China.

The writing on the wall is clear: if you want to win in e-commerce in 2020 and beyond, you have to have a robust mobile experience. This can be in the form of a responsive website or a full-fledged mobile app, but it needs to be pleasant, personalized, and effective.
If you’re targeting emerging markets, then your mobile experience should be the first priority ahead of desktop.
3. 39% of Shoppers Prefer Electronic Payment Methods
Selling anything online meant accepting debit and credit cards. But that reality is quickly changing.
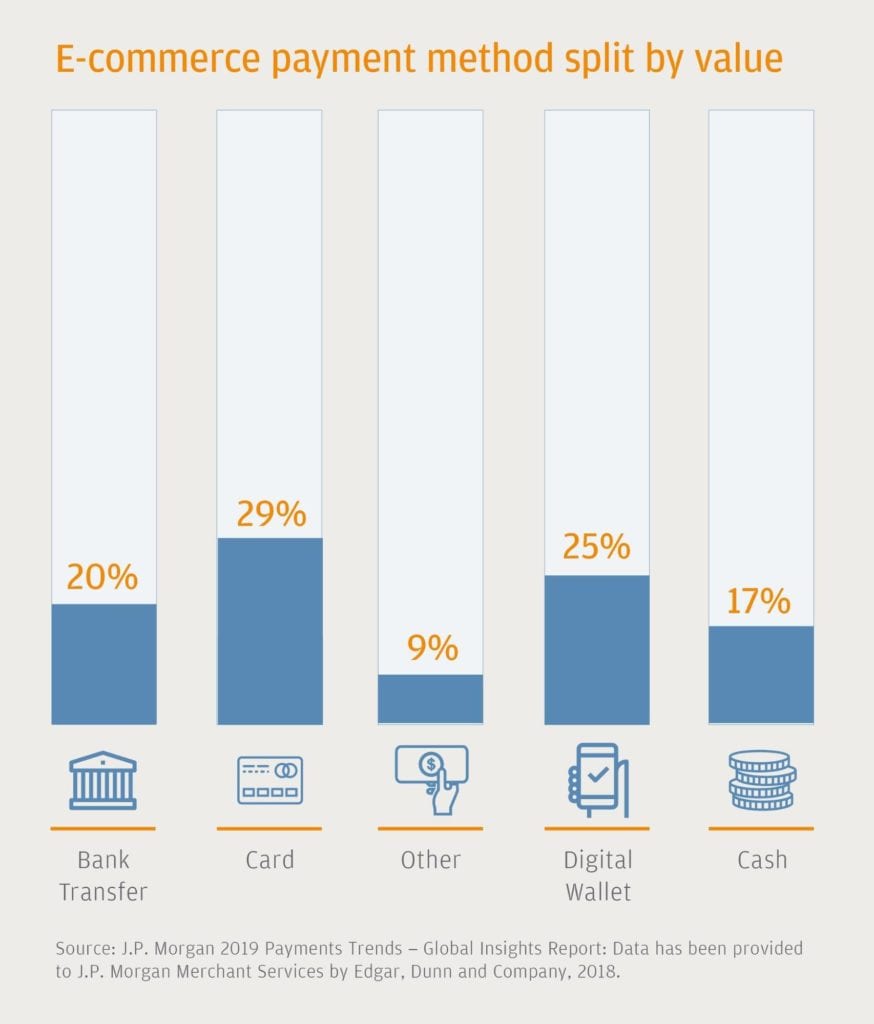
More and more customers are switching to electronic payment methods such as PayPal and digital wallets. According to one study, 39% prefer this method, while 20% prefer bank transfers.
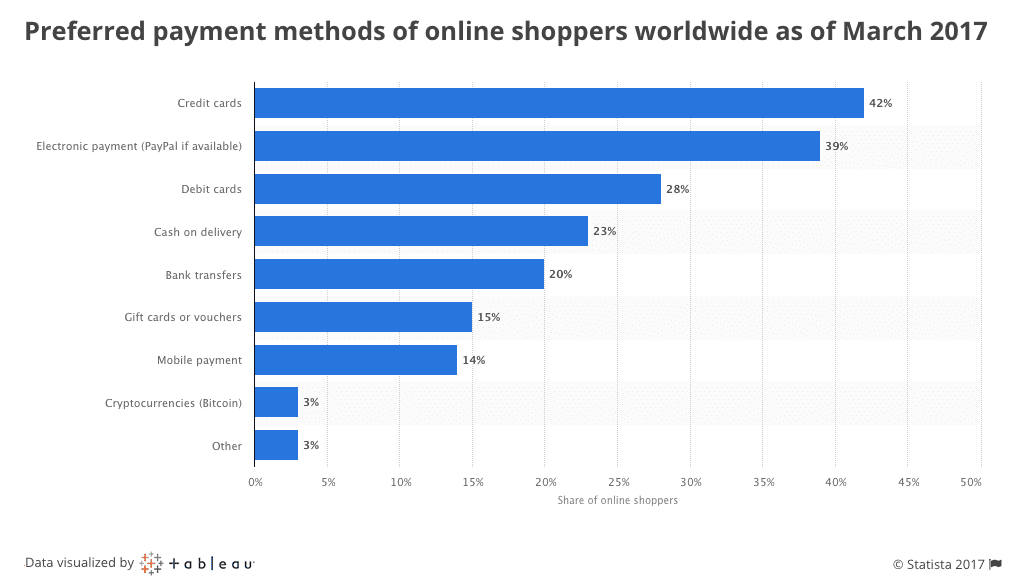
Once again, emerging markets are leading the way. Low credit card penetration, widespread smartphone adoption, and safety concerns mean that mobile wallets, bank transfers, and even cash on delivery are more popular than credit/debit cards.
For instance, JP Morgan estimates that digital wallets, bank transfers, and cash on delivery make up 62% of all e-commerce transactions in India.
For e-commerce businesses, the lesson is clear: if you want to attract more customers, you have to offer more payment options. It’s not enough to add a debit/credit card form and call it a day. You’ll have to include all the popular payment methods in your local market, and even consider international options if you sell globally.
4. 91.1% of E-Commerce Social Referrals Come From Facebook and Instagram
You already know that Facebook and Instagram are crucial sources of traffic for your business.
But the sheer scale of their importance might shock you.
According to eMarketer, Facebook and Instagram accounted for 80.4% and 10.7% of all social referrals to e-commerce sites in the US in Q1 2019.
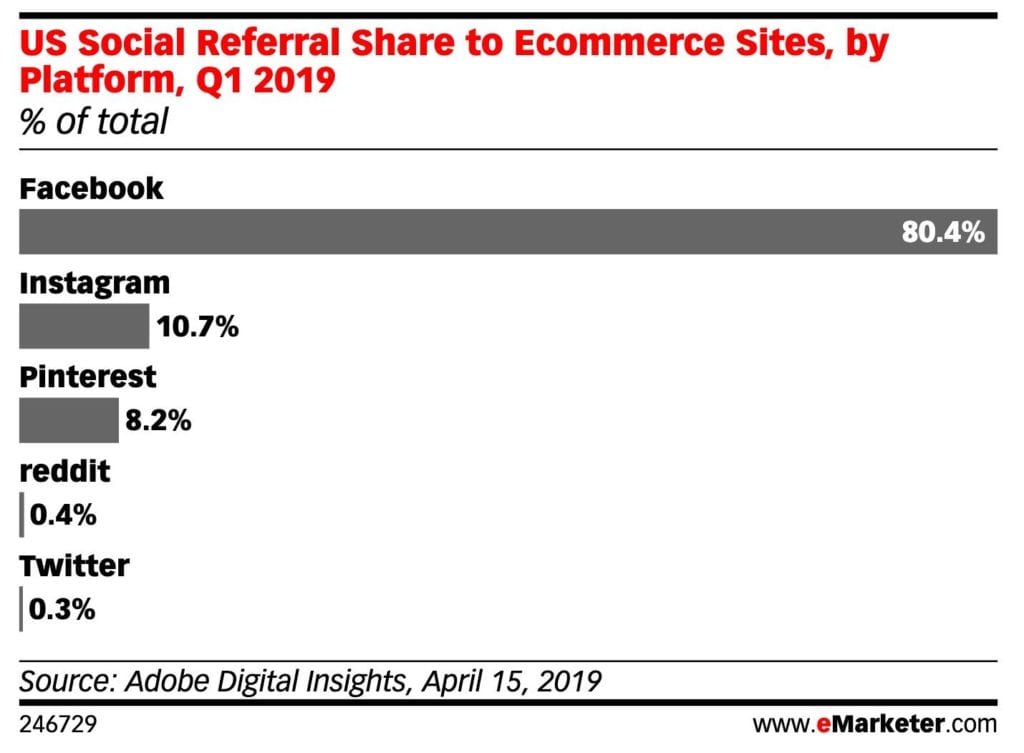
Sure, Facebook’s audience might be declining, but it’s still the dominant social network online. Whatever audience Facebook is losing is being picked up by Instagram.
If you’re running an e-commerce store, ignore Facebook and Instagram at your own peril. These two networks will drive the bulk of your social traffic and sales. Try different growth hacks to increase shares – both on your site and on the network itself. Something as simple as testing different locations for your share buttons can increase click-throughs, as it did for UpWorthy.
5. Search Accounts for 61% of All E-Commerce Traffic
While social is certainly important, Search is still the king of all online traffic. According to Wolfgang Digital’s 2019 KPI report, organic and paid search account for 43% and 18% of all traffic to retail sites.
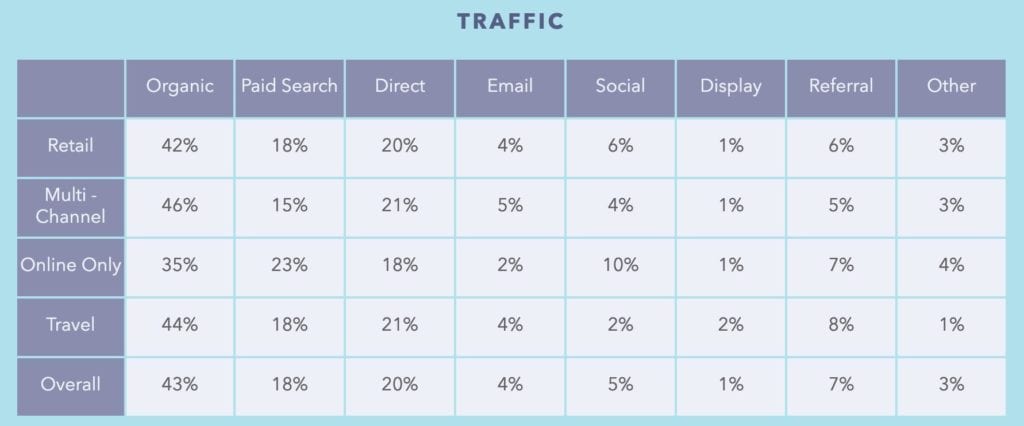
Online-only retail sites rely slightly less on search (58%) and more on social (10% vs 5% overall). This can be attributed to anything from a lack of expertise in SEO to the relatively small size of online stores.
What’s interesting is how revenues compared to traffic. According to the same report, paid search and email both have a higher share of revenue than of traffic, particularly for online-only stores.
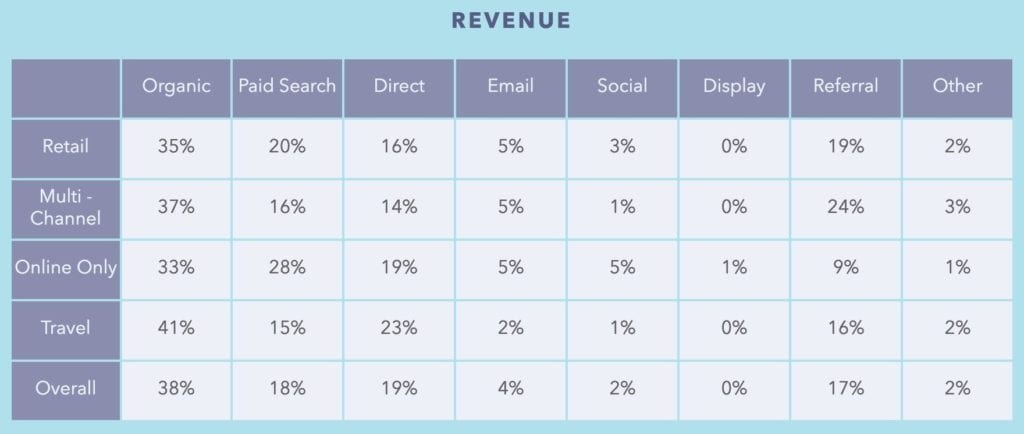
The implication? Paid search and email both convert better. If you want to quickly ramp up revenues, these two channels should be your top priority.
6. More and More Consumers Expect to Buy Directly From Manufacturers
There is a big change afoot in the way customers buy and manufacturers sell.
The conventional model involves manufacturers selling their wares to wholesalers, who sell it to distributors, who finally sell it to retailers.
Each of these intermediaries takes their cut which adds to the final cost for consumers.
Thanks to the internet, manufacturers are increasingly skipping the intermediaries and selling directly to consumers. This is particularly true for smaller manufacturers that don’t have the margins or the network to sell to wholesalers and distributors.
Consumers also expect it. According to one survey, 40% of consumers expect to make 40-100% of their purchases directly from manufacturers.
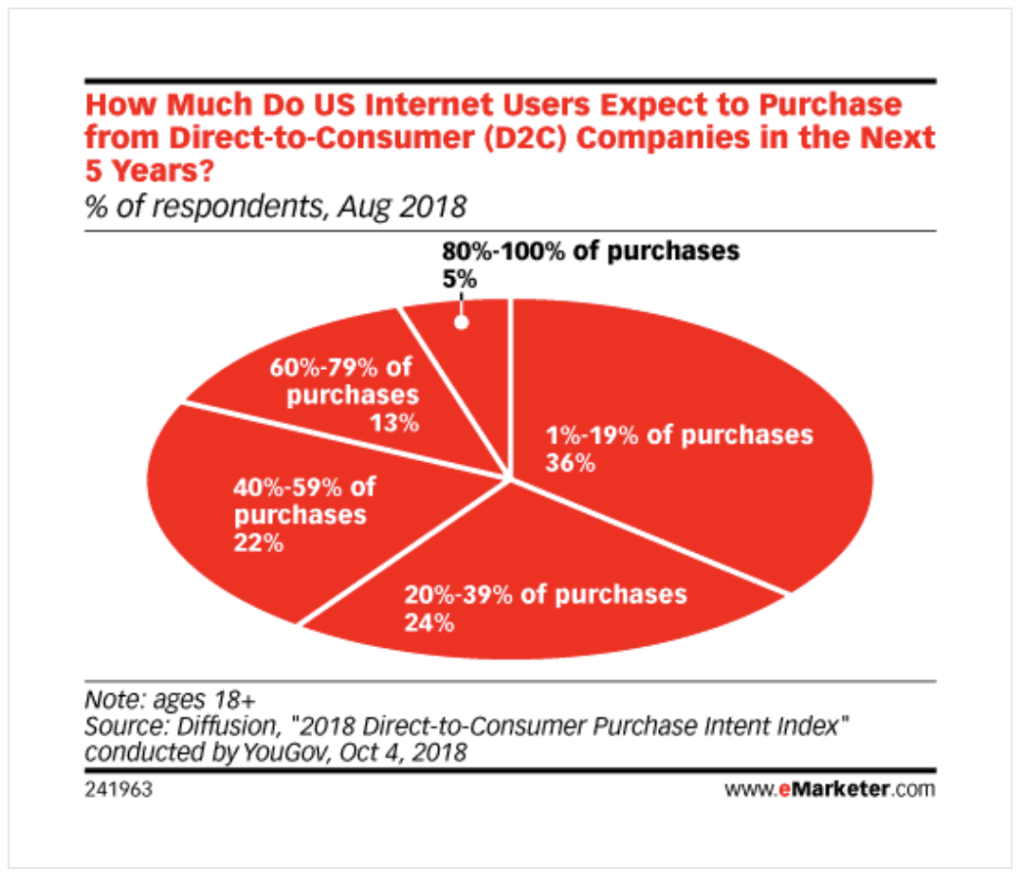
This “Direct to Consumers” (D2C) model represents a complete realignment of the manufacturer-customer relationship. It means that manufacturers have higher margins, but also have to build up competence in areas like marketing and logistics.
If you’re a manufacturer, consider boosting your skills and talent in these areas. Your customers expect to buy directly from you. Make sure that you don’t disappoint them.
Over to You
E-commerce marketing is changing fast. How customers find your store, how they pay for goods, and the kind of service they expect has shifted in the last few years.
To thrive in 2020 and beyond, you’ll need to adapt your store to these changes. By changing your marketing approach and using better e-commerce software, you can attract more customers and serve them better.
 |
Kate Lynch is a business and digital marketing blogger who spends her entire day writing quality blogs. She is a passionate reader and loves to share quality content prevalent on the web with her friends and followers, keeping a keen eye on the latest trends and news in those industries. Follow her on twitter @IamKateLynch for more updates. |

Yan Anderson is the Head of Content Marketing at CS-Cart with over 10 years of experience in the eCommerce industry. He's passionate about explaining complicated things in simple terms. Yan has expertise in building, running and growing eCommerce marketplaces. He loves to educate people about best practices, new technologies, and trends in the global eCommerce industry.